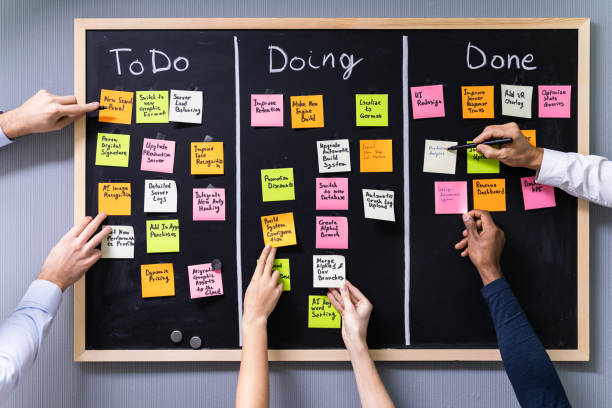
The first and most important thing for you is understanding what it takes to get an item from a request to a deliverable product. Recognizing how work flows through your system will set you on the path to continuous improvement by making well-observed and necessary changes.
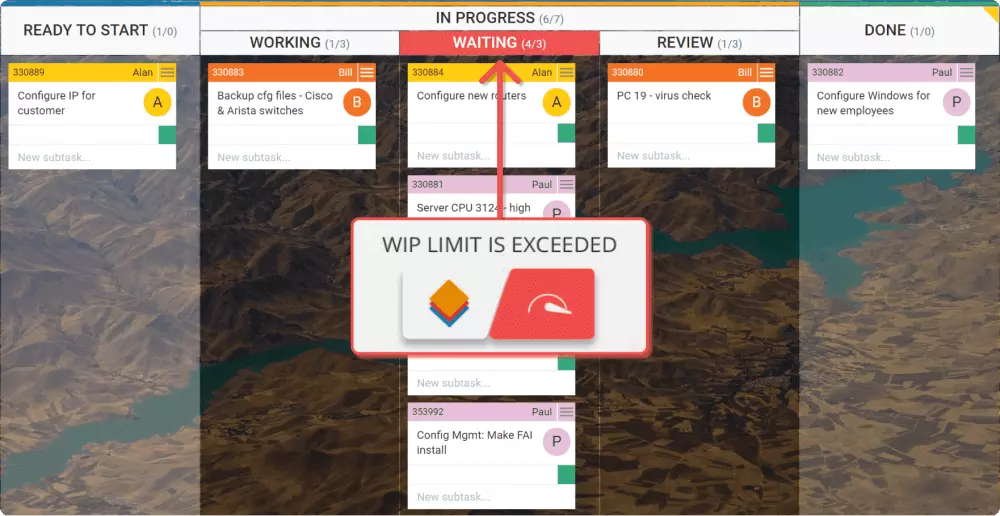
Implementing a pull system on parts or the complete workflow. Setting maximum items per stage ensures that a card is only “pulled” into the next step when there is available capacity. Such constraints will quickly illuminate problem areas in your flow so you can identify and resolve them.
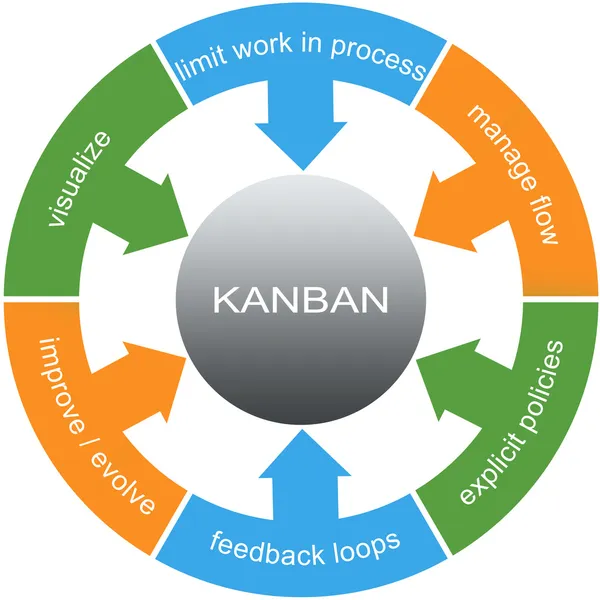
Managing the flow is about managing the work but not the people. By flow, we mean the movement of work items through the production process at a predictable and sustainable pace. Kanban system is to create a smooth, healthy flow.
Your process should be clearly defined, published, and socialized. Sparse, visible, well-defined, and subject to change, work policies have the power to boost people’s self-organization.
For teams and companies that want to be more agile, implementing feedback loops is a mandatory step. They ensure that organizations are adequately responding to potential changes and enable knowledge transfer between stakeholders.
The way to achieve continuous improvement and sustainable change within an organization is through collaboratively implementing changes based on scientifically proven methods, feedback, and metrics.
Scrum is an Agile methodology designed for complex projects where it is frequently necessary to adapt to change.
There are cases where you don't want or need a modern kanban board to run sprints in. In simple scrum, you do prioritize your cards vertically, but you only move the tasks of a card in the task board. When all tasks are done, then the card is considered done.
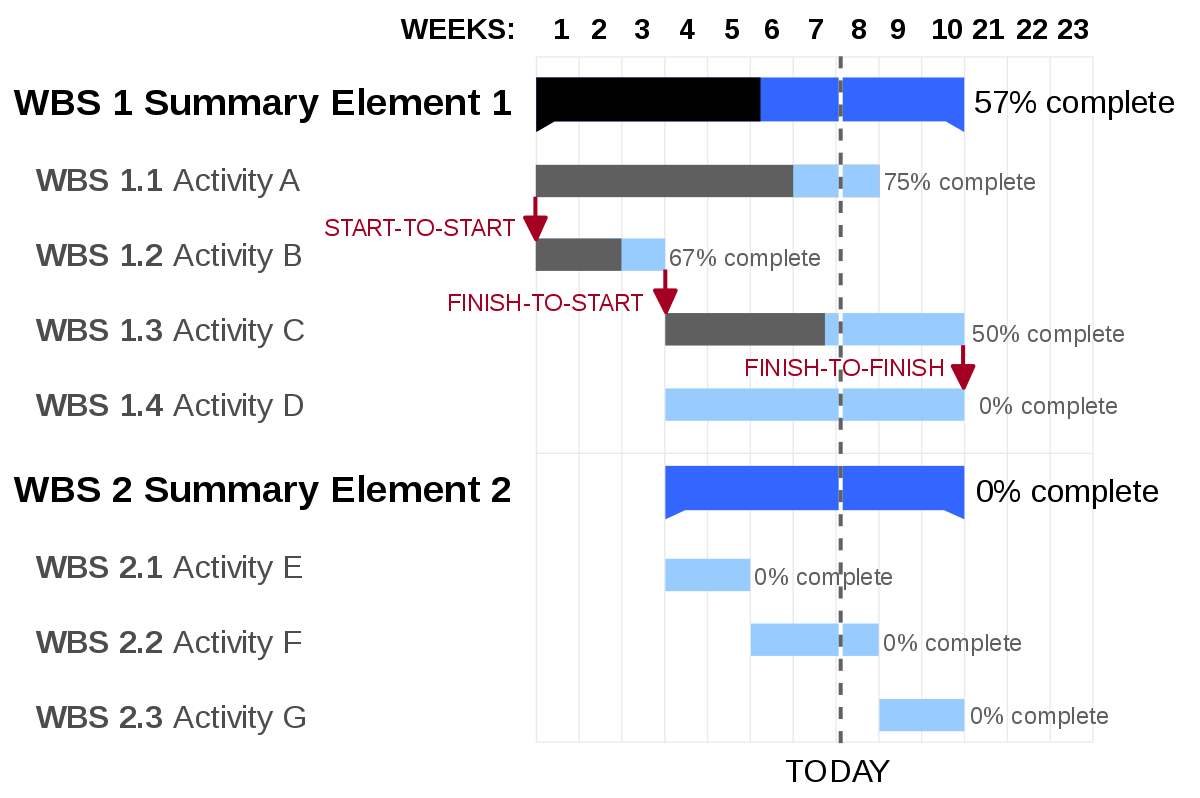
A Gantt chart is a visualization that helps in scheduling, managing, and monitoring specific tasks and resources in a project.
It consists of a list of tasks and bars depicting each task's progress.
The horizontal bars of different lengths represent the project timeline, which can include task sequences, duration, and the start and end dates for each task.
It's the most widely used chart in project management.
Gantt charts are used in heavy industries for projects like building dams, bridges, and highways, as well as software development and building out of other goods and services.
Gantt charts help visualize various tasks and projects that occur simultaneously within an organization, and how far along they have progressed. They are used by management to plan and schedule such projects so that resources can be allocated in an optimal way and that projects that are prioritized can finish before less important ones begin.
The Gantt chart is the most widely used chart in project management. These charts are useful in planning a project and defining the sequence of tasks that require completion. In most instances, the chart is displayed as a horizontal bar chart.